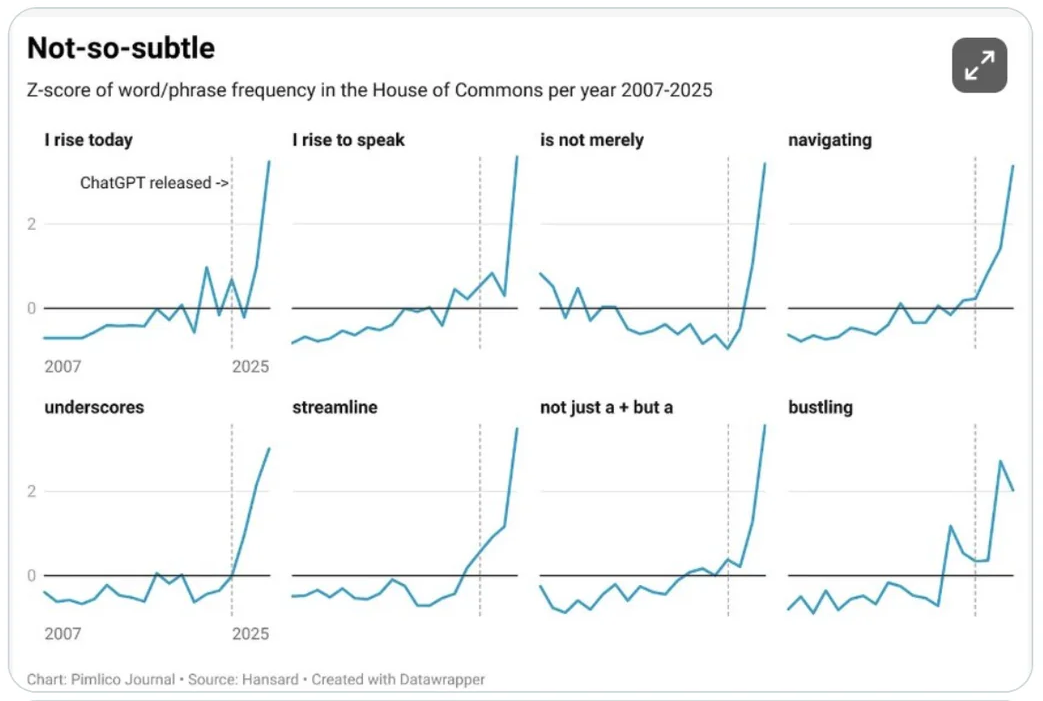
When dealing with real world data, it’s always a good idea to check how normal it is. If that assumption is grossly violated, you have to work a bit harder and use more robust methods.
When it’s reasonably close to normal, you can take all sorts of nice shortcuts like z-scores and t-tests. I haven’t looked into this case yet, but I assume they knew what they were doing.
Yup, although technically you can still run z-tests and t-tests for statistical validity because samples are always normally distributed around a population mean (as long as it’s a large enough sample), even for skewed or uniform distributions. Some tests work better than others, though. The graphs z might be a sample, which might make sense is population data is available for these phrases, but otherwise I’m a little confused why that’d use it, lol.
To clarify for the commenter, though, Z-scores themselves can be applied to individuals; it’s just a simple conversation setting mean to 0 and standard deviation to 1. In that case, it’s strictly a relative case, that 2.5% isn’t a probability so much as the percentile – % cases that fall below that score. It’s a nifty metric to compare things that aren’t on the same scale, for instance.